A +3,418% TAO strategy, run through four gates
The best SMA crossover a scan could find on TAO passes walk-forward, beats a thousand shuffled markets, and survives its own re-deals — then fails the false-discovery gate by a whisker. Every number is reproducible from the seeds given.
Data frozen as of 2026-08-11 · 2023-03-04 → 2026-08-11 · fee 0.05% · seed 12345 — this analysis does not auto-update.
1. The claim
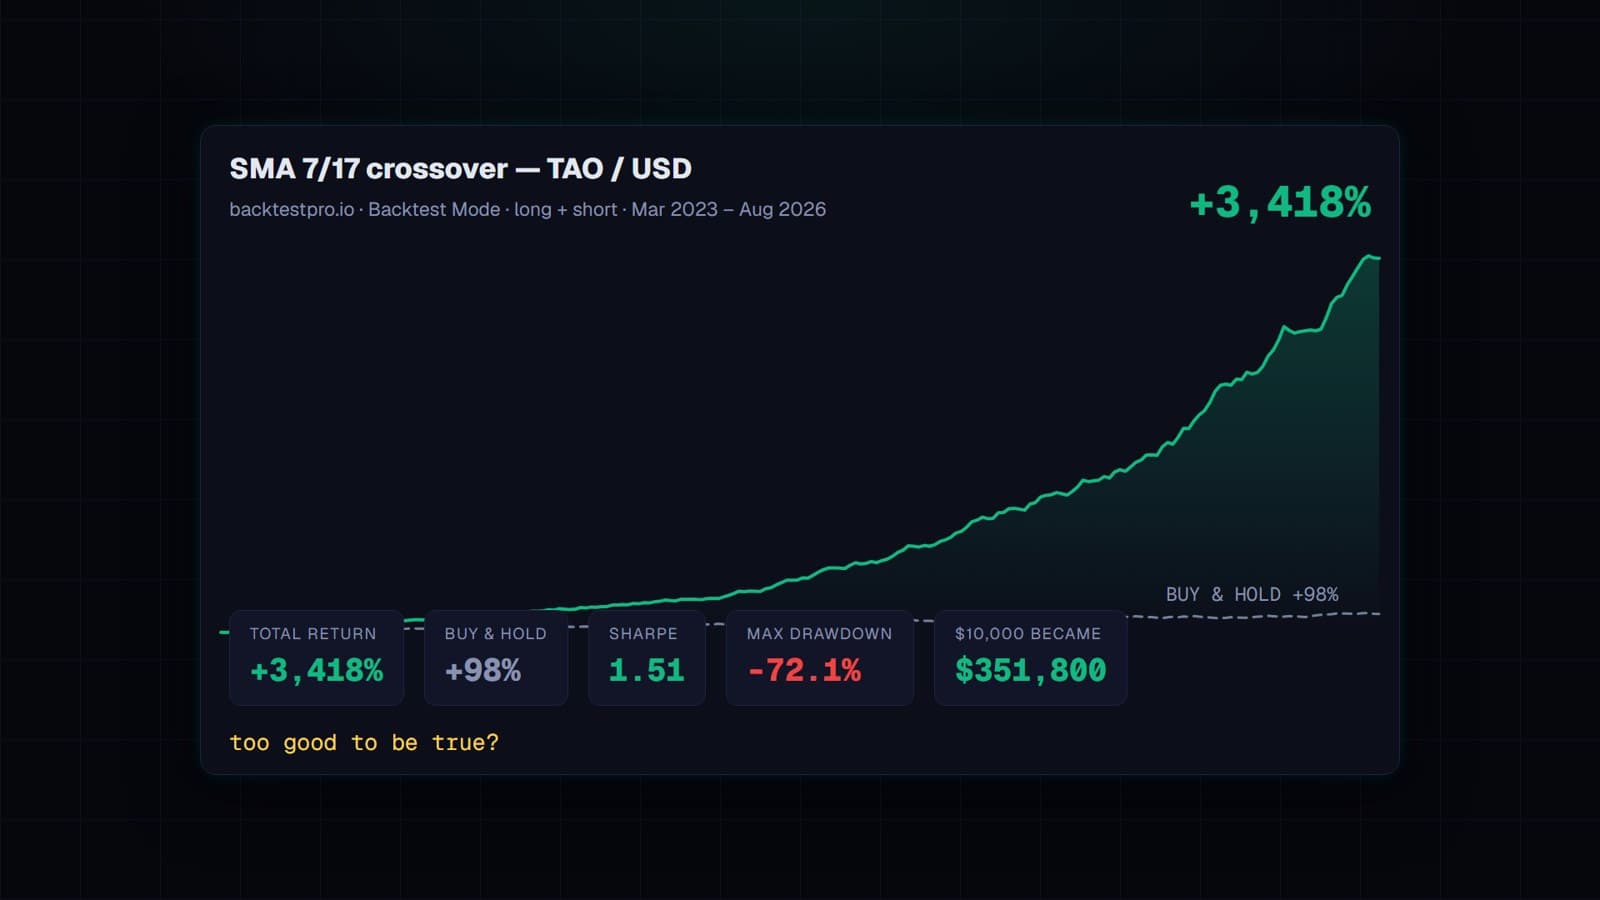
On the crossover scanner — TAO as base asset, SMA × SMA, long + short, no leverage, all available data, optimised for annualised return — the best of 780 combinations is the SMA 7/17 crossover. Its full-window backtest: +3,418% total return vs +98% buy-and-hold, Sharpe 1.51, Sortino 2.48, max drawdown −72.1%, win rate 48.6%, 70 closed trades. $10,000 became $351,800. (The pinned-window rerun used for the gates returns +3,451%; the live figure drifts by a few percent with each new daily bar.)
2. Why the search is the thing under test
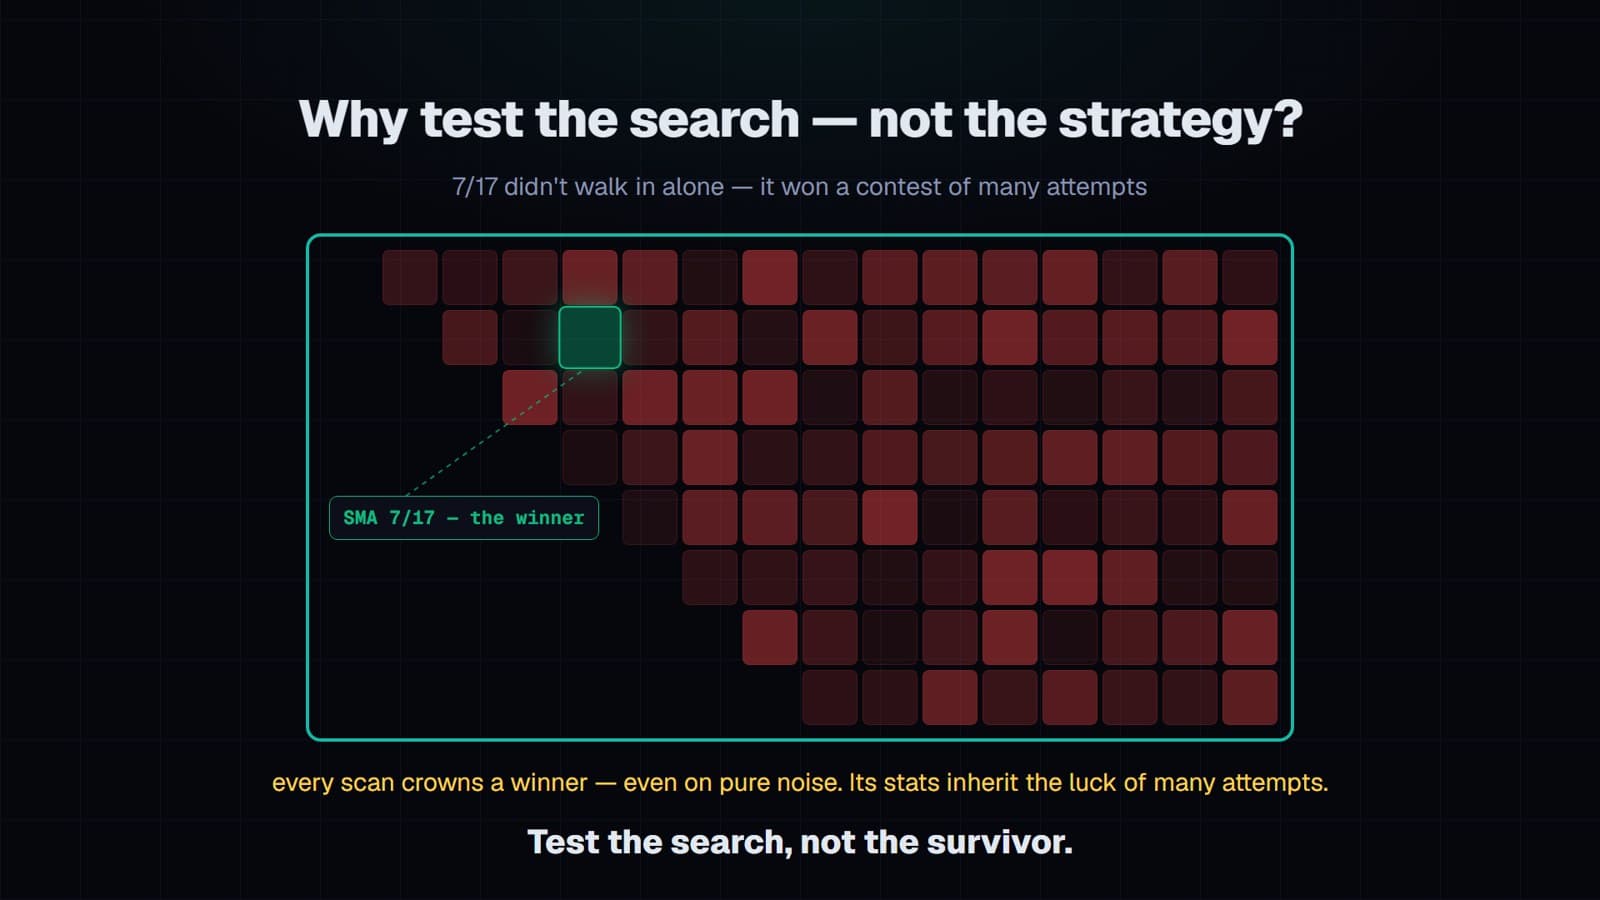
7/17 was not a hypothesis. It was the greenest cell on a heatmap of 780 tries. That distinction decides everything that follows, because a backtest can deceive in three distinct ways: the rule memorised the past (tuned until it fits every wiggle), it got lucky (randomness alone produces winners), or it is the best of many tries (scan enough combinations and something always glows).
The third is the trap for anything found by scanning. Seven heads in a row is remarkable from one coin-tosser and unremarkable from a hundred; a strategy's stats carry the luck of every attempt that lost to it. So the tests below never evaluate 7/17 in isolation. They evaluate the search that produced it, declared up front as a family card:
- Searched: fast ∈ {3, 5, 7, 10, 15, 20} · slow ∈ {10, 17, 20, 30, 50, 100, 200}, fast < slow · exposure ∈ {long/cash, long/short, short/cash} → 111 combinations
- Fixed: SMA on both legs · 0.05% fee · no leverage · compounding · daily bars · fills at the signal bar's close
Why 111 and not 780. The site's scanner sweeps a dense grid; the card is a coarser, declared version of the same search, pinned so the permutation null can re-run it thousands of times. Neighbouring SMA pairs are near-duplicates, so the coarser grid prices the search's effective breadth honestly; a denser card would change the numbers only marginally and the verdict not at all.
3. Gate 1 — Walk-forward
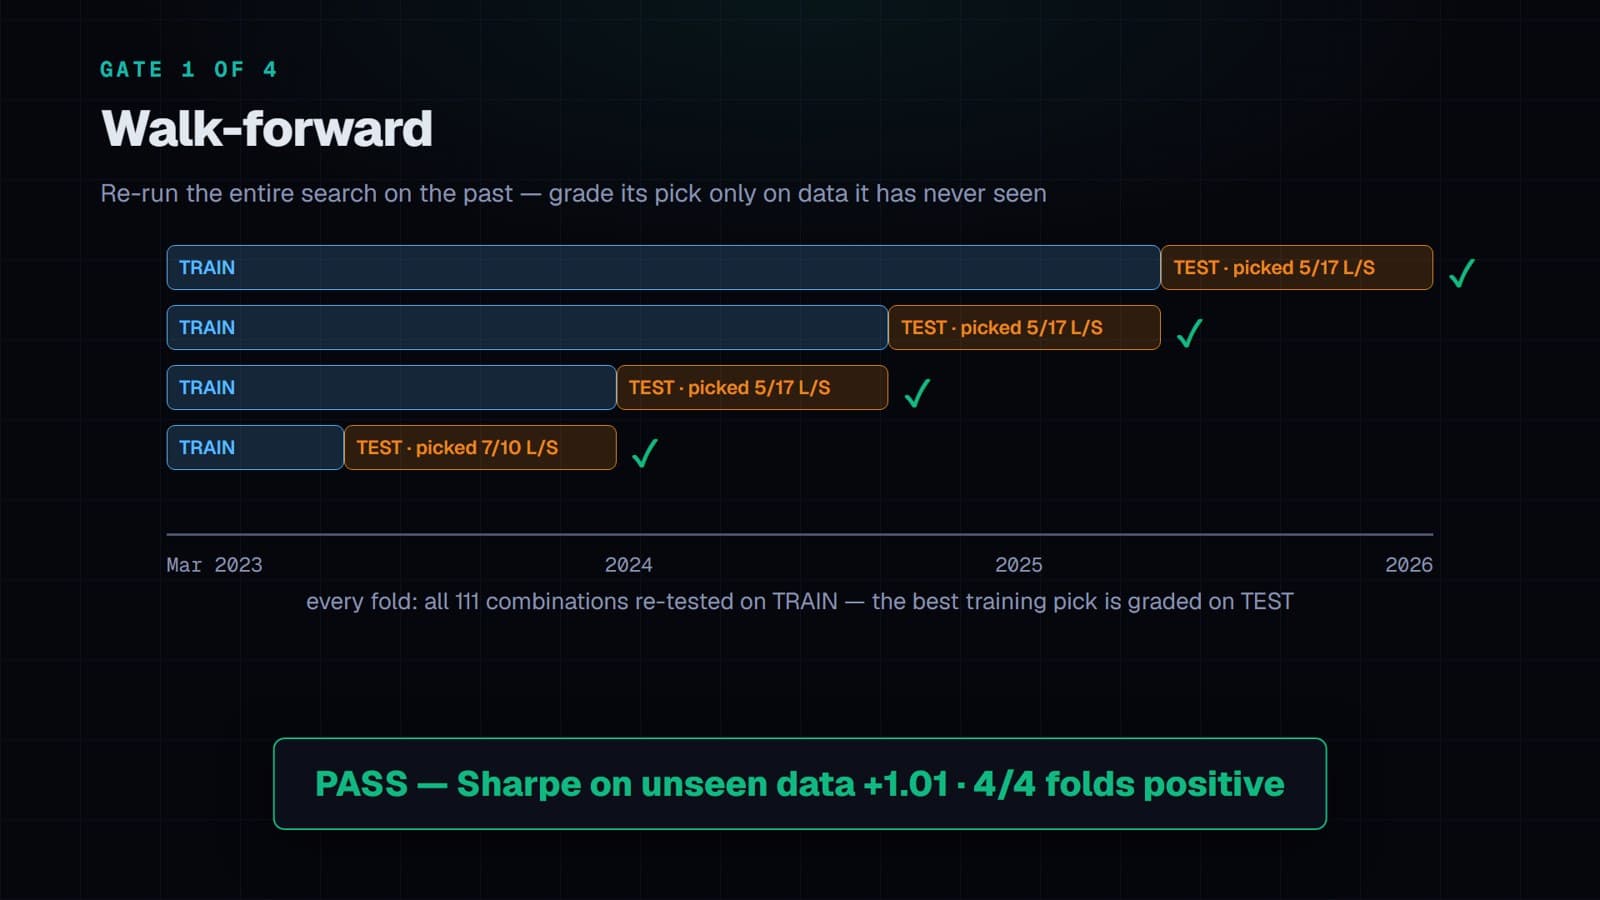
What it does. Split the history into a training stub plus four consecutive test blocks. For each block, re-run the entire 111-combination search on all data before it, keep the best in-sample pick, then grade that pick only on the block it has never seen — with indicators and position state carried across the boundary, as they would be live. Training data always strictly precedes test data.
Pass rule. Mean Sharpe across the four unseen blocks > 0 — a floor, not a grade. Quality is priced by the later gates.
| Fold | Search picked | In-sample Sharpe | Unseen Sharpe | Unseen return | Evaluable / declared |
|---|---|---|---|---|---|
| 1 | SMA 7/10 long-short | 2.15 | 1.65 | +163.7% | 93 / 111 |
| 2 | SMA 5/17 long-short | 2.74 | 0.98 | +42.9% | 111 / 111 |
| 3 | SMA 5/17 long-short | 2.12 | 0.76 | +21.3% | 111 / 111 |
| 4 | SMA 5/17 long-short | 1.77 | 0.64 | +16.3% | 111 / 111 |
| Mean | 2.20 | 1.01 |
The honest search never chose 7/17 — it chose 5/17 long-short in three folds running, a sibling that backtests slightly better still. The 18 combinations fold 1 could not evaluate are the 100- and 200-day slow averages, which need more history than a 180-day training stub contains; the gate reports that rather than hiding it. PASS.
4. Gate 2 — Permutation test
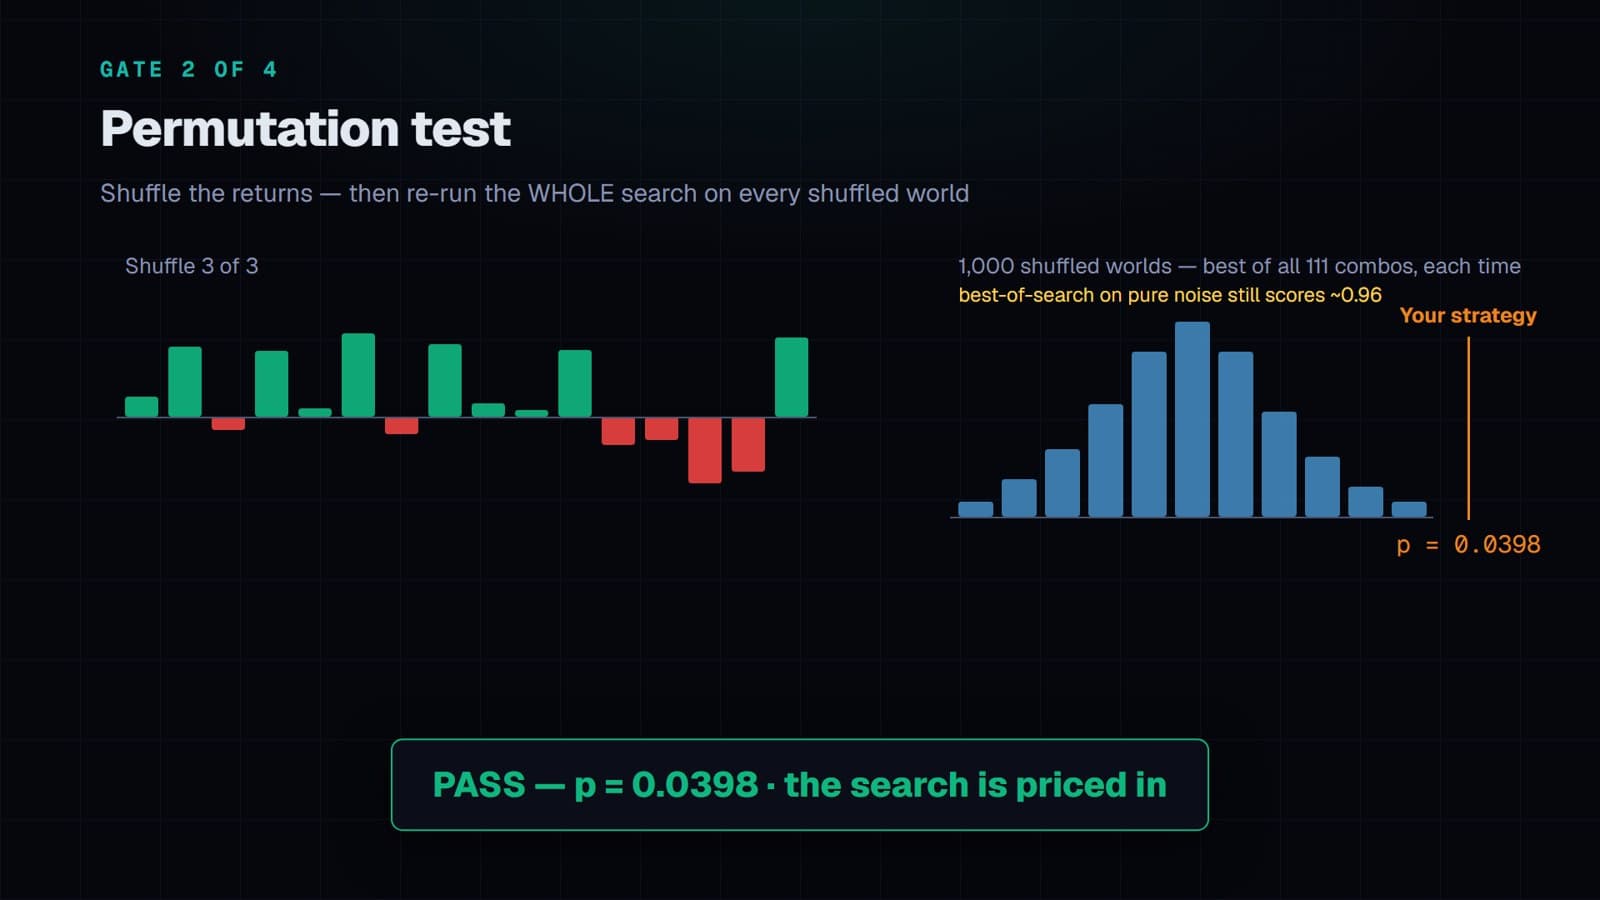
What it does. Shuffle the order of TAO's daily log-returns — the same moves dealt in a random sequence, so start price, end price, drift and volatility are preserved and only the sequence a crossover feeds on is destroyed. Then run the whole 111-combination search on that counterfeit market and keep its best Sharpe. Repeat for 5,000 counterfeit markets. The p-value is the fraction whose best-of-search beat the real best-of-search.
Pass rule. p < 0.05.
Real best-of-search Sharpe 1.57 (5/17 long-short). On the shuffled markets the best cell scores a median 0.96 and a 95th-percentile 1.52 — on a market with nothing to find, every heatmap still has a glowing cell. The real search beat all but 198 of 5,000 noise-worlds: (198 + 1) / 5,001 = p = 0.0398. PASS — and the honest version of a number that looked far better before the search was priced in: 7/17 alone claimed p = 0.0149 (200 shuffles); the whole search scored 0.037 at 1,000 shuffles and 0.0398 at 5,000.
| What was tested | Shuffles | p-value |
|---|---|---|
| SMA 7/17 alone (the survivor) | 200 | 0.0149 |
| The whole 111-combo search | 1,000 | 0.037 |
| The whole search, refined | 5,000 | 0.0398 |
5. Gate 3 — Monte Carlo
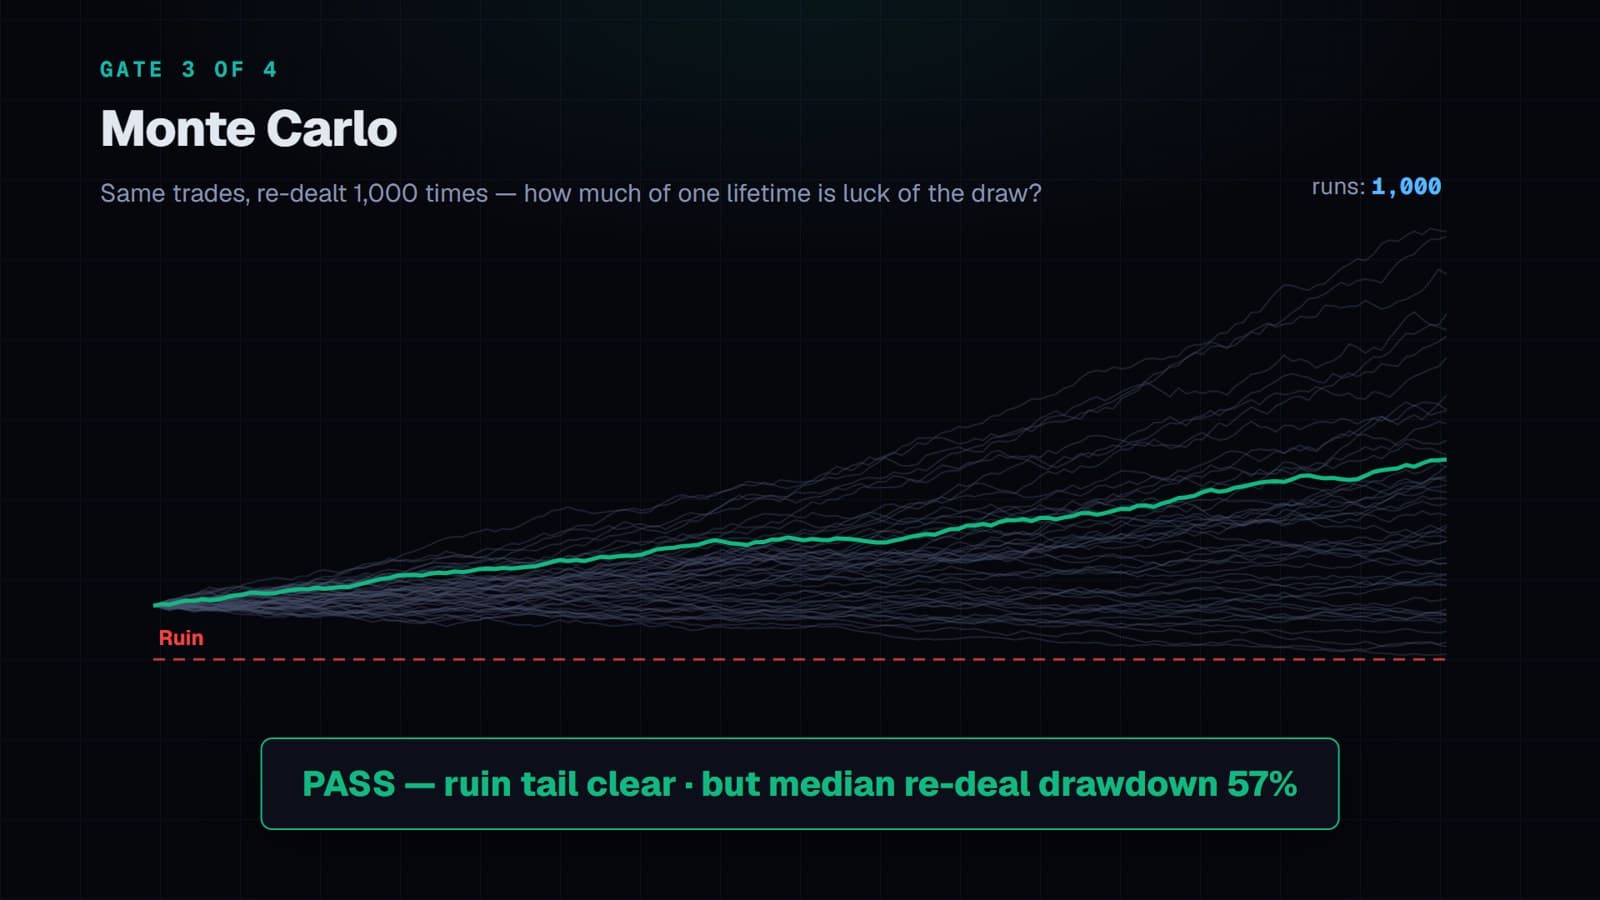
What it does. The strategy always produces the same 72 trades; what varies between lifetimes is which of them, and in what order, history serves you. So: draw 72 trades from those 72 with replacement, compound them, record the final value and the worst drawdown. Do it 1,000 times, on the search's honest pick (5/17 long-short) at 0.05% fees.
Pass rule. The 5th-percentile lifetime must end above −50% of starting capital — a survival bar, not a quality bar.
| 1,000 re-deals of 72 trades | p5 | Median | p95 | Observed |
|---|---|---|---|---|
| Final return | +43.9% | +4,165% | +250,364% | +4,330% |
| Max drawdown | 37.4% | 57.4% | 82.2% | 59.7% |
The worst plausible lifetime still finishes up 44%: PASS. The observed history lands at the 51st percentile of its own re-deals — which with-replacement resampling produces almost by construction, so it is not evidence of robustness and is not leaned on. The disclosure that matters is the drawdown row: a typical lifetime with these trades sits through a 57% drawdown, and one in twenty sees 82%.
Known limitations of this gate. The ruin rule is evaluated at the end of each re-deal: a lifetime that touches −60% and recovers counts as a survivor, though live it might not. Trades are resampled independently, which understates how losses cluster — so the drawdown figures are the optimistic floor. Both are logged upgrades (a barrier-style ruin check; a block bootstrap). This strategy clears the current bar by a wide margin, so neither changes its verdict.
6. Gate 4 — False discovery
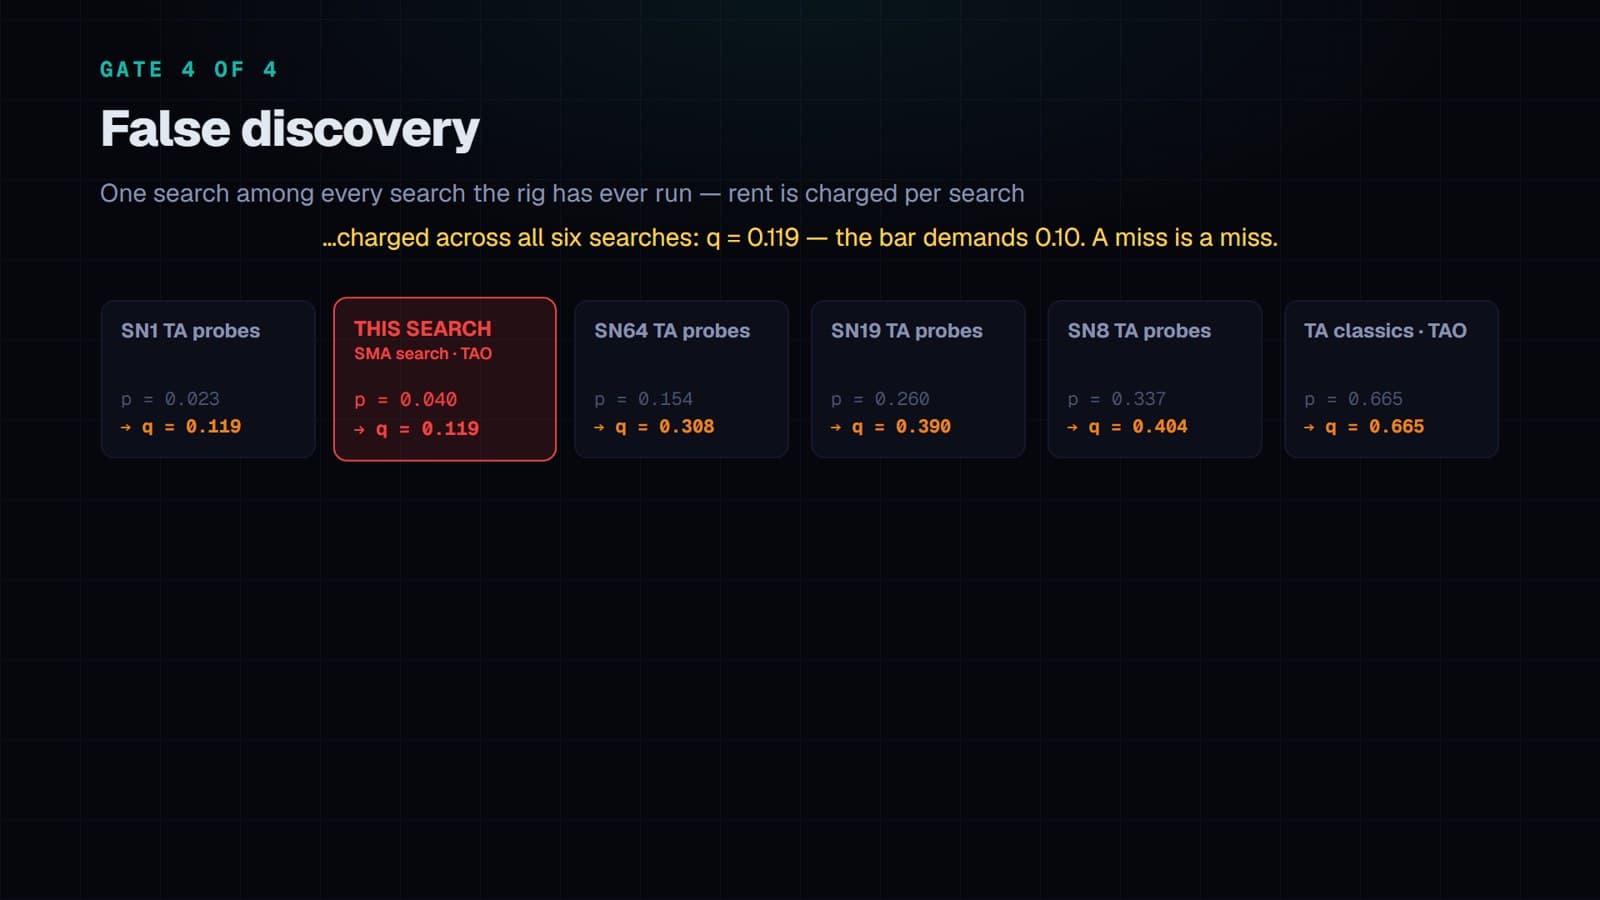
What it does. Gates 1–3 price the selection inside this search. They cannot see the selection between searches: if this one had failed, another asset, window or family could have been tried until something passed. So every search the rig has ever run enters one registry, and the Benjamini–Hochberg procedure charges each result rent for the whole crowd: line the searches up by p-value; each one's q-value is its p × (number of searches) ÷ (its rank), smoothed so q never rises down the list. A q-value is a promise about the scoreboard — of everything called real at this threshold, this fraction is expected to be luck.
Pass rule. q < 0.10, fixed on 2026-08-12 before any of these results existed.
| Search | Lane | p | Shuffles | q | |
|---|---|---|---|---|---|
| Four TA probes on SN1 | pre-registered | 0.0228 | 5,000 | 0.119 | FAIL |
| SMA search on TAO (this note) | found | 0.0398 | 5,000 | 0.119 | FAIL |
| Four TA probes on SN64 | pre-registered | 0.154 | 1,000 | 0.308 | FAIL |
| Four TA probes on SN19 | pre-registered | 0.26 | 1,000 | 0.39 | FAIL |
| Four TA probes on SN8 | pre-registered | 0.337 | 1,000 | 0.404 | FAIL |
| 24 textbook TA rules on TAO | pre-registered | 0.665 | 1,000 | 0.665 | FAIL |
The SMA search's q of 0.119 is 0.0398 × 6 ÷ 2. Because it sat so close to the bar at 1,000 shuffles, both near-bar p-values were re-run at 5,000 before this note was written — the miss is measured, not rounding. FAIL.
What the whisker means. A near-miss is exactly where discipline is tested. At q = 0.119 this strategy would pass a bar of 0.15 — a perfectly defensible bar, had it been chosen in advance. It wasn't. The number matters less than its timestamp: the bar was written down before the score was known, and it does not move afterwards.
7. Two stress tests
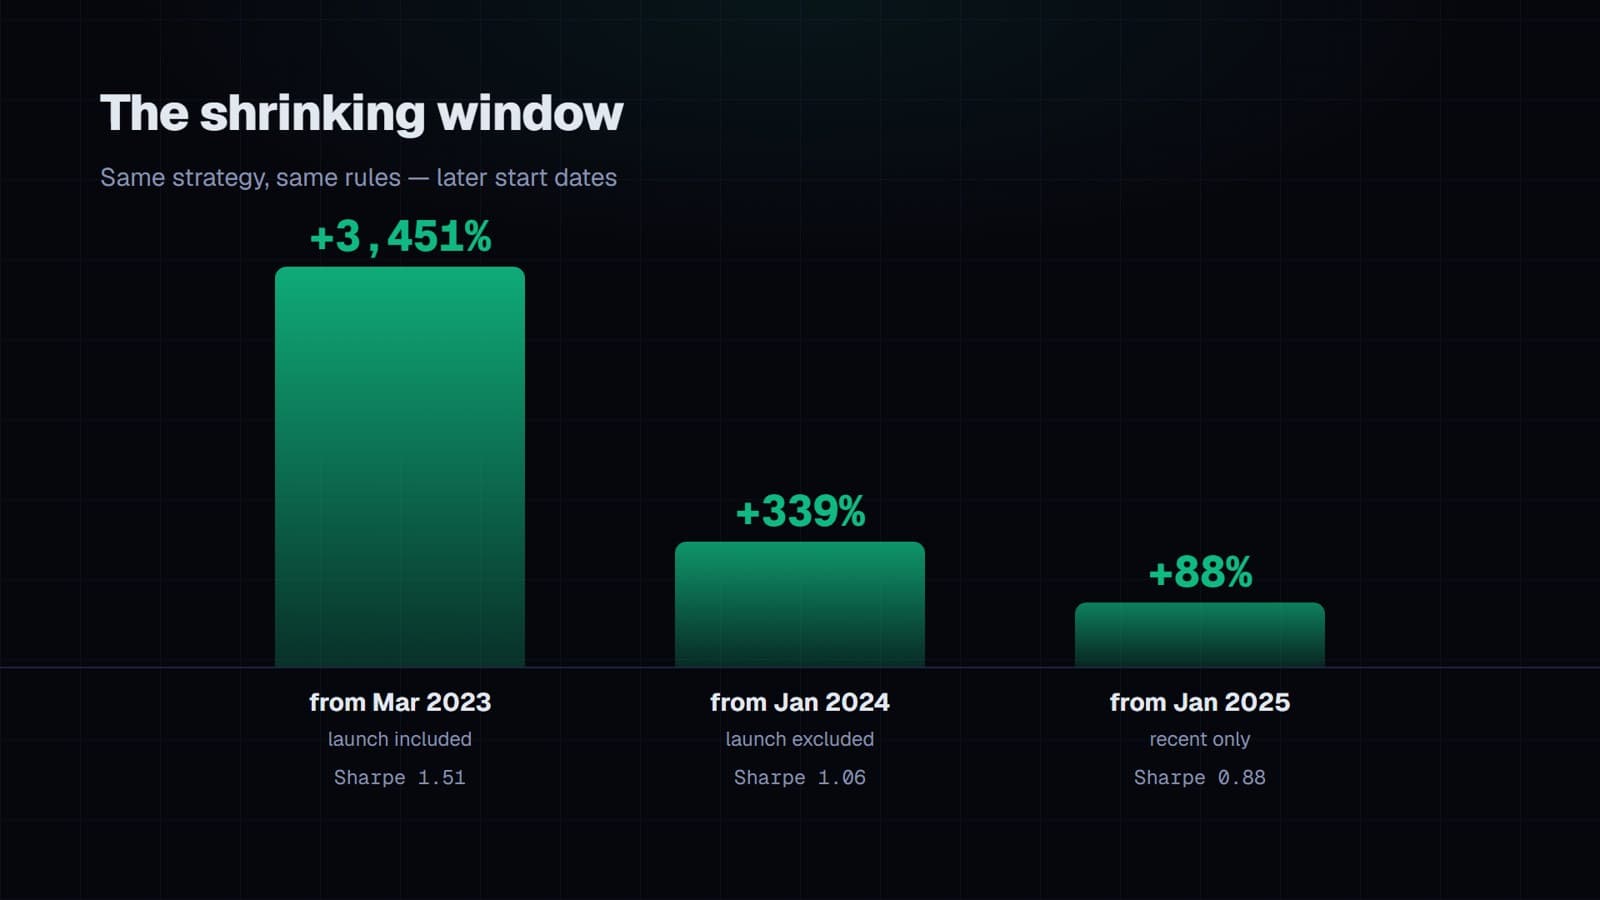
The shrinking window. Same rules, later start dates: from Mar 2023 +3,451% (Sharpe 1.51); from Jan 2024 +339% (1.06); from Jan 2025 +88% (0.88). Most of the headline was earned in TAO's first year, and TAO's emission rules have changed repeatedly since — returns in one regime say little about the next.
| Window | Total return | Sharpe |
|---|---|---|
| From Mar 2023 (launch included) | +3,451% | 1.51 |
| From Jan 2024 (launch excluded) | +339% | 1.06 |
| From Jan 2025 (recent only) | +88% | 0.88 |
Can it actually be traded?
- The short leg. No spot borrow market for TAO at retail scale; every short is a perpetual paying funding around the clock. The backtest charges none of it.
- The fills. The backtest trades at the signal bar's own close. Live, you get whatever price comes next.
- The seat. A typical re-dealt lifetime sits through a 57% drawdown; the observed history hit −72%. Few people hold a strategy through that.
8. Verdict
A real momentum effect on TAO, most of it earned in a regime that has not repeated, that does not clear the bar for selection. Not traded.
Passing tests is not a prophecy; it is permission to keep watching. The one thing that could still clear this search is data it never touched. The search was run on 2026-08-12, so every daily bar since is untouched by construction — the strategy is being tracked forward, in public, and this note will be updated when there is enough of it to say something.
9. Reproduce it
The claim. Backtest → Crossover Scanner → base asset TAO → SMA × SMA → Long + Short → all available data → run. The best cell is 7/17; open it in Backtest mode for the full stats.
The gates. All four run from the BacktestPro engine's MCP tools, driven from any AI CLI: list_family_cards → walk_forward_family (folds = 4) → family_permutation (n = 5,000, seed 12345) → monte_carlo on the search's pick (n = 1,000, fee 0.05%) → fdr_scoreboard. Window 2023-03-04 → 2026-08-11.
Determinism. Every random process is seeded (12345). The permutation null is cached per search and window, so the whole cascade re-runs in about three seconds; rebuilding the 5,000-world null from scratch takes ~35 minutes.
Further reading. David Aronson, Evidence-Based Technical Analysis — the case for treating technical rules as hypotheses and pricing data-mining bias, including the reality-check idea behind Gate 2. Marcos López de Prado, Advances in Financial Machine Learning, chapters 11–14, for the institutional treatment of backtest overfitting. Benjamini & Hochberg (1995) for the procedure behind Gate 4.
Educational research, not financial advice. Cryptoassets are high-risk and unregulated; you could lose all the money you invest. Backtested results are hypothetical and do not predict future performance. Nothing here is a recommendation to buy, sell, or trade any asset. Numbers are frozen to the data window above and will drift with new bars; the seeds and tools listed reproduce them exactly.